Accessible Mobility · TransitEase
An early idea for getting people where they're going, with AI as a quiet assist.
TransitEase is an AI-powered public transportation app concept that enhances the commuting experience by optimizing routes based on real-time crowd data, weather conditions, and safety information, so people get tailored suggestions for the least crowded vehicles and localized safety alerts.
- Role
- UX Research & Prototyping, team project
- Timeline
- Course project, Fall 2024
- Contribution
- Research, conceptual model, prototyping, AI feature integration
Where it started
Public transit's daily reality: crowding, uncertainty, and safety worries.
We aimed to develop an AI-powered public transportation app that enhances the commuting experience by optimizing routes based on real-time crowd data, weather conditions, and security information. By providing tailored suggestions for the least crowded vehicles and localized safety alerts, the app ensures a comfortable and secure travel environment for all users, including those with diverse needs and preferences. I worked on this with Joshua Phillips and Utkarsha Nagtode.
- Overcrowding: transit cars and stations run at or above capacity during rush hour, causing delays, discomfort, and elevated safety hazards.
- Safety uncertainty: commuters are frequently unaware of accidents, thefts, or security threats without real-time alerts, which undermines trust in the system.
- Accessibility gaps: many transit systems don't sufficiently accommodate people with impairments or language barriers.
Concept in one breath
TransitEase fuses real-time crowd density sensing, dynamic route optimization, and safety alerts into one easy-to-use, inclusive interface, giving commuters practical insights for safer, more comfortable travel.
Research
Understanding transit difficulties
An extensive review of prior research and papers on public transportation concerns shaped our thinking from the start.
Evaluating the market
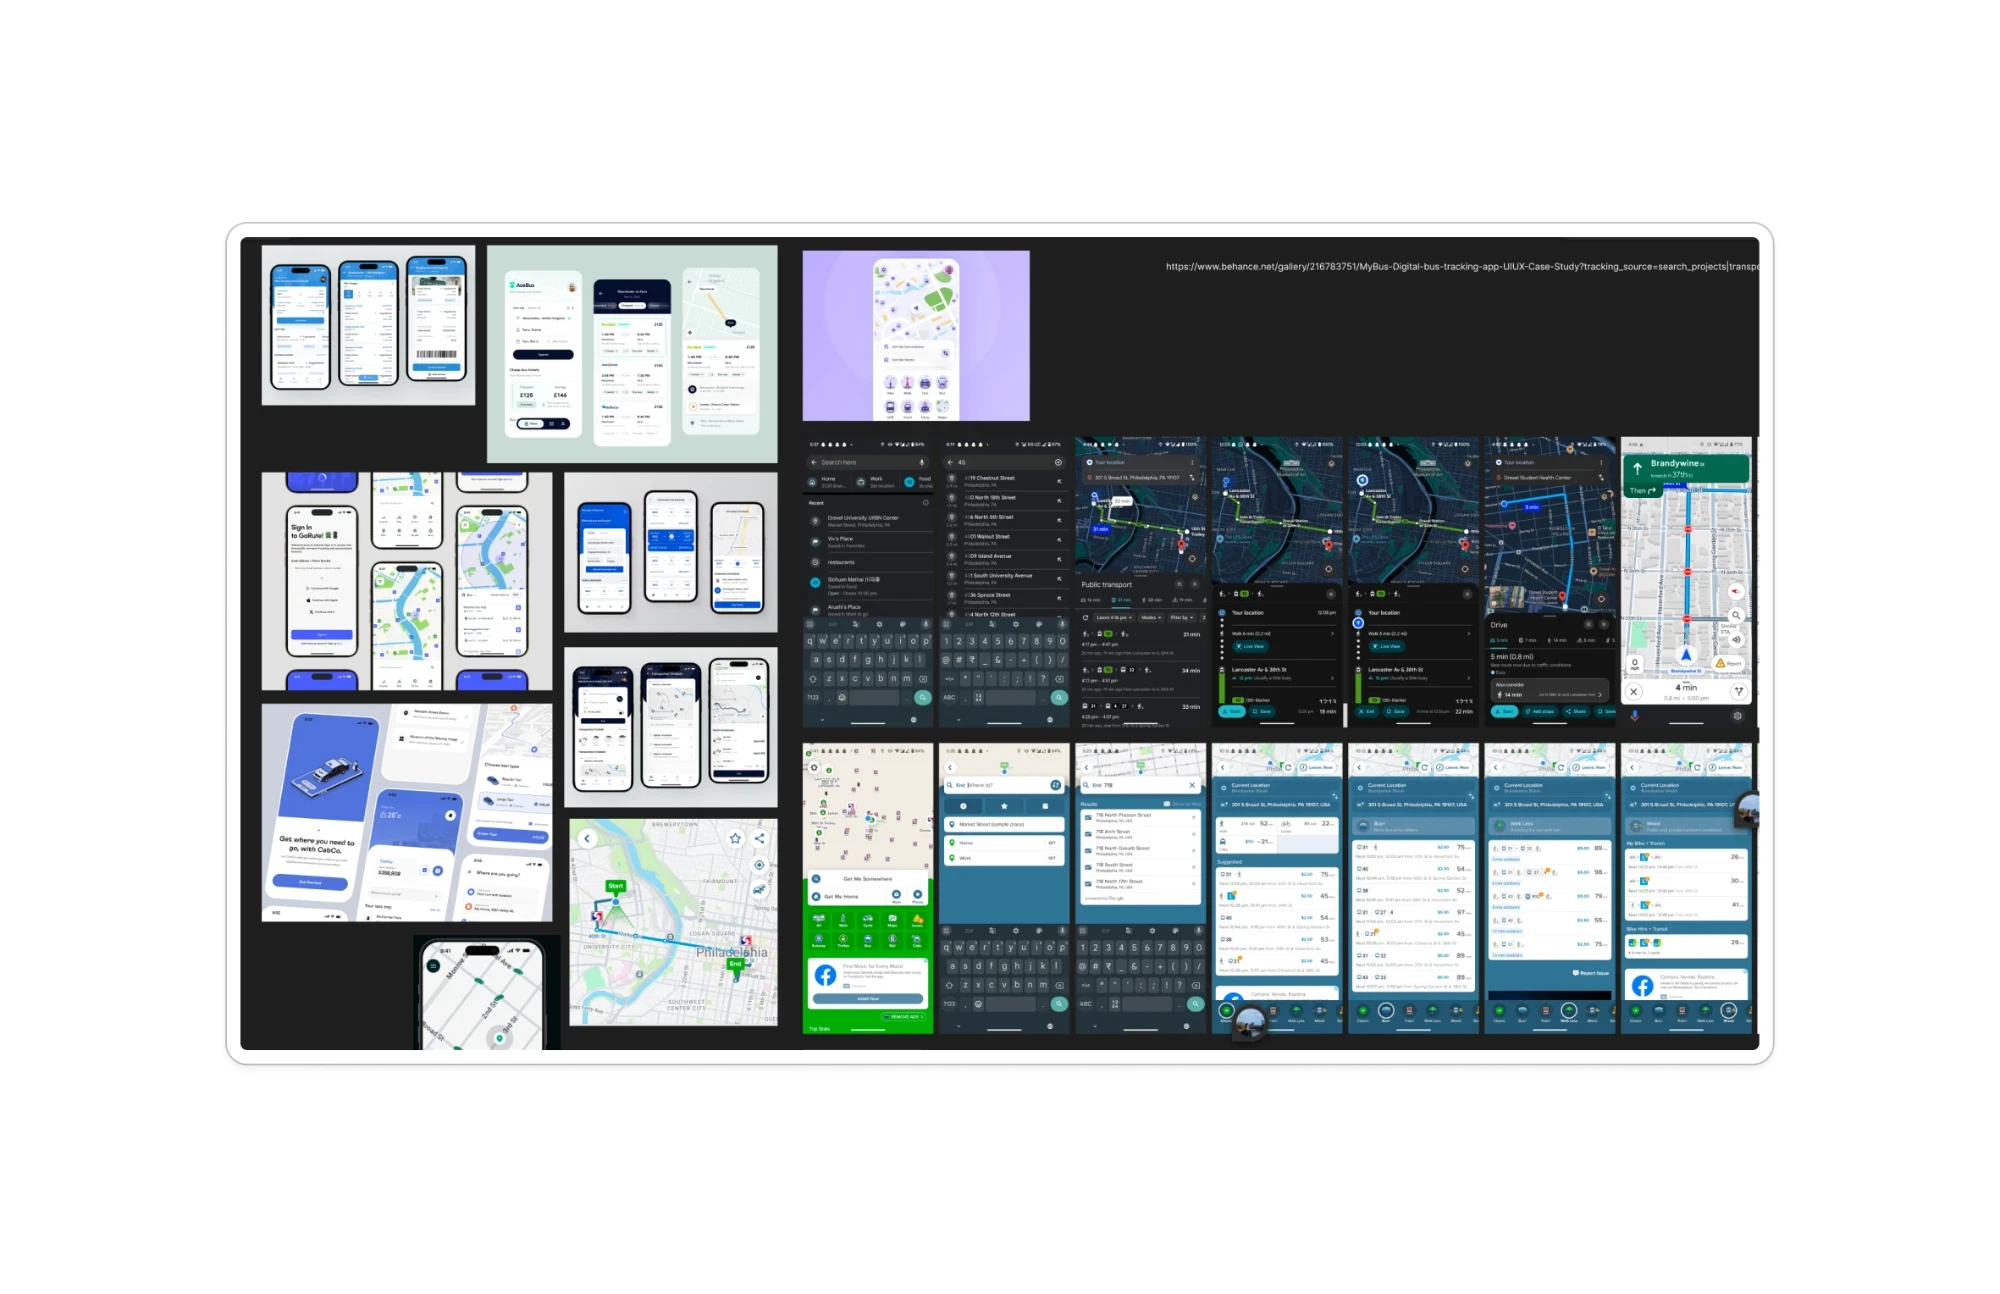
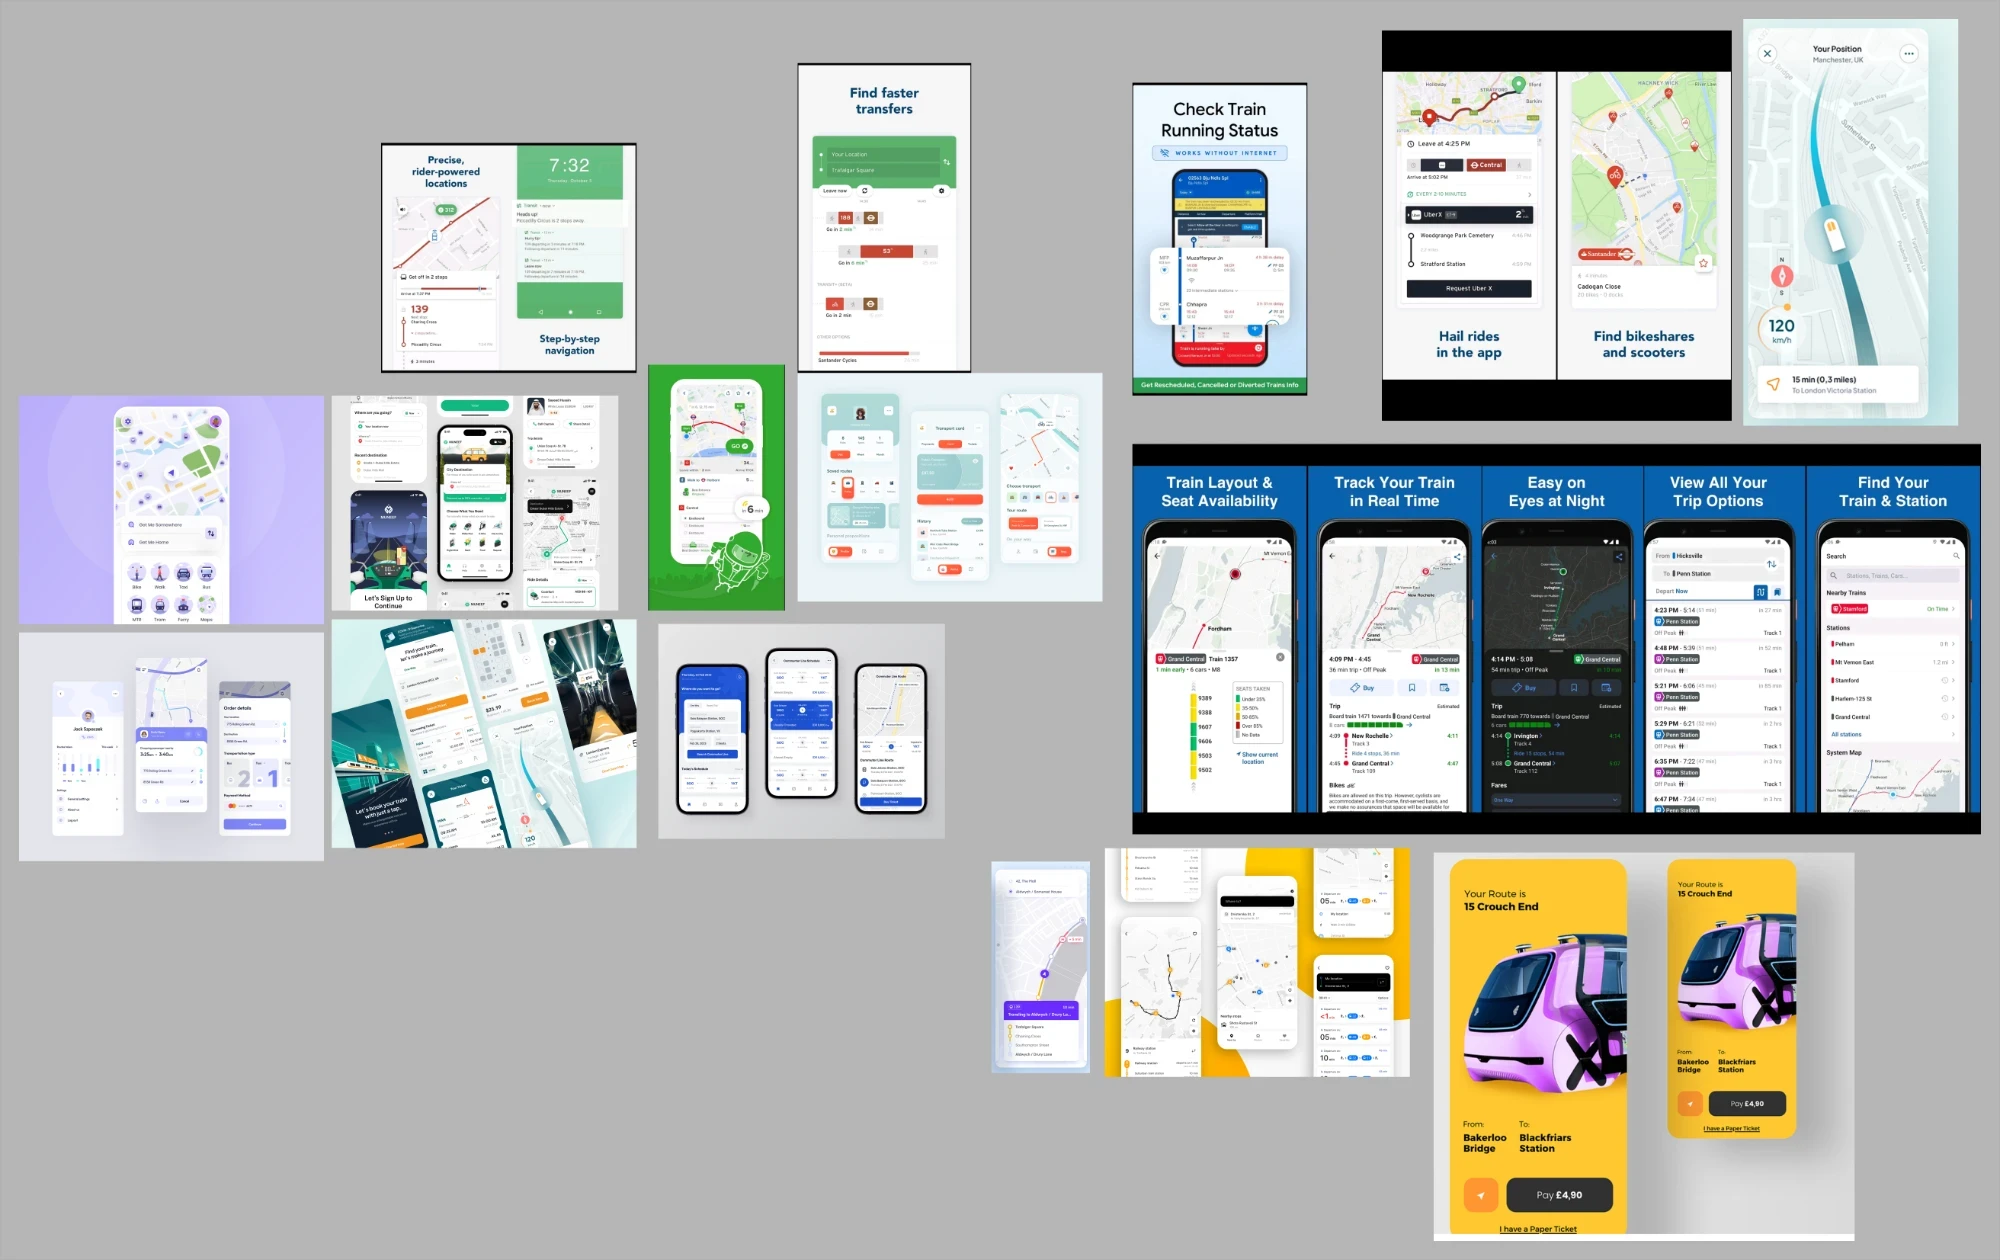
A comparative look at popular transit apps, Moovit, Transit, and Google Maps, found they offer basic navigation and timetable information but lack real-time crowd density visualizations and safety indicators tailored to user preferences. That gap confirmed TransitEase's dynamic safety alerts and personalized route optimization were worth building.
Data and prototyping feasibility
We looked at IoT-enabled sensors, user-submitted reports, and machine learning datasets to confirm real-time crowd density classification was feasible, alongside weather, traffic, and transit schedule APIs. Google's Teachable Machine proved suitable for building the crowd-classification model, and Figma was chosen for UI/UX design for its collaborative, easy-to-use tooling.
From problem to product
Ten ideas, narrowed to one
We ran a brainstorming session and came up with ten possible directions for an AI-powered public transportation feature.
- Dynamic route optimization: recommend routes based on real-time events, traffic, crowd density, and weather.
- Crowd density visualization: color coding or heat maps showing vehicle and station crowding.
- Real-time weather adaptations: adjust timing and routes to forecasts.
- Personalized route recommendations: machine learning tuned to comfort, safety, and speed preferences.
- Safety alerts & warnings: immediate notice of maintenance, delays, or security incidents.
- Accessibility-first method: low-crowd alternatives, elevator/escalator availability, wheelchair-accessible routes.
- User-reported conditions: traveler reports on cleanliness, crowding, and security.
- AI-powered predictive analysis: forecast crowd sizes and suggest better travel times.
- Feedback-driven model training: continuously refine suggestions from user input.
- Environmentally friendly routing: prioritize lower-impact options.
Our vote split between route optimization, safety alerts, and crowd density visualization, so we combined them: dynamic route optimization with real-time safety and comfort metrics became the project.
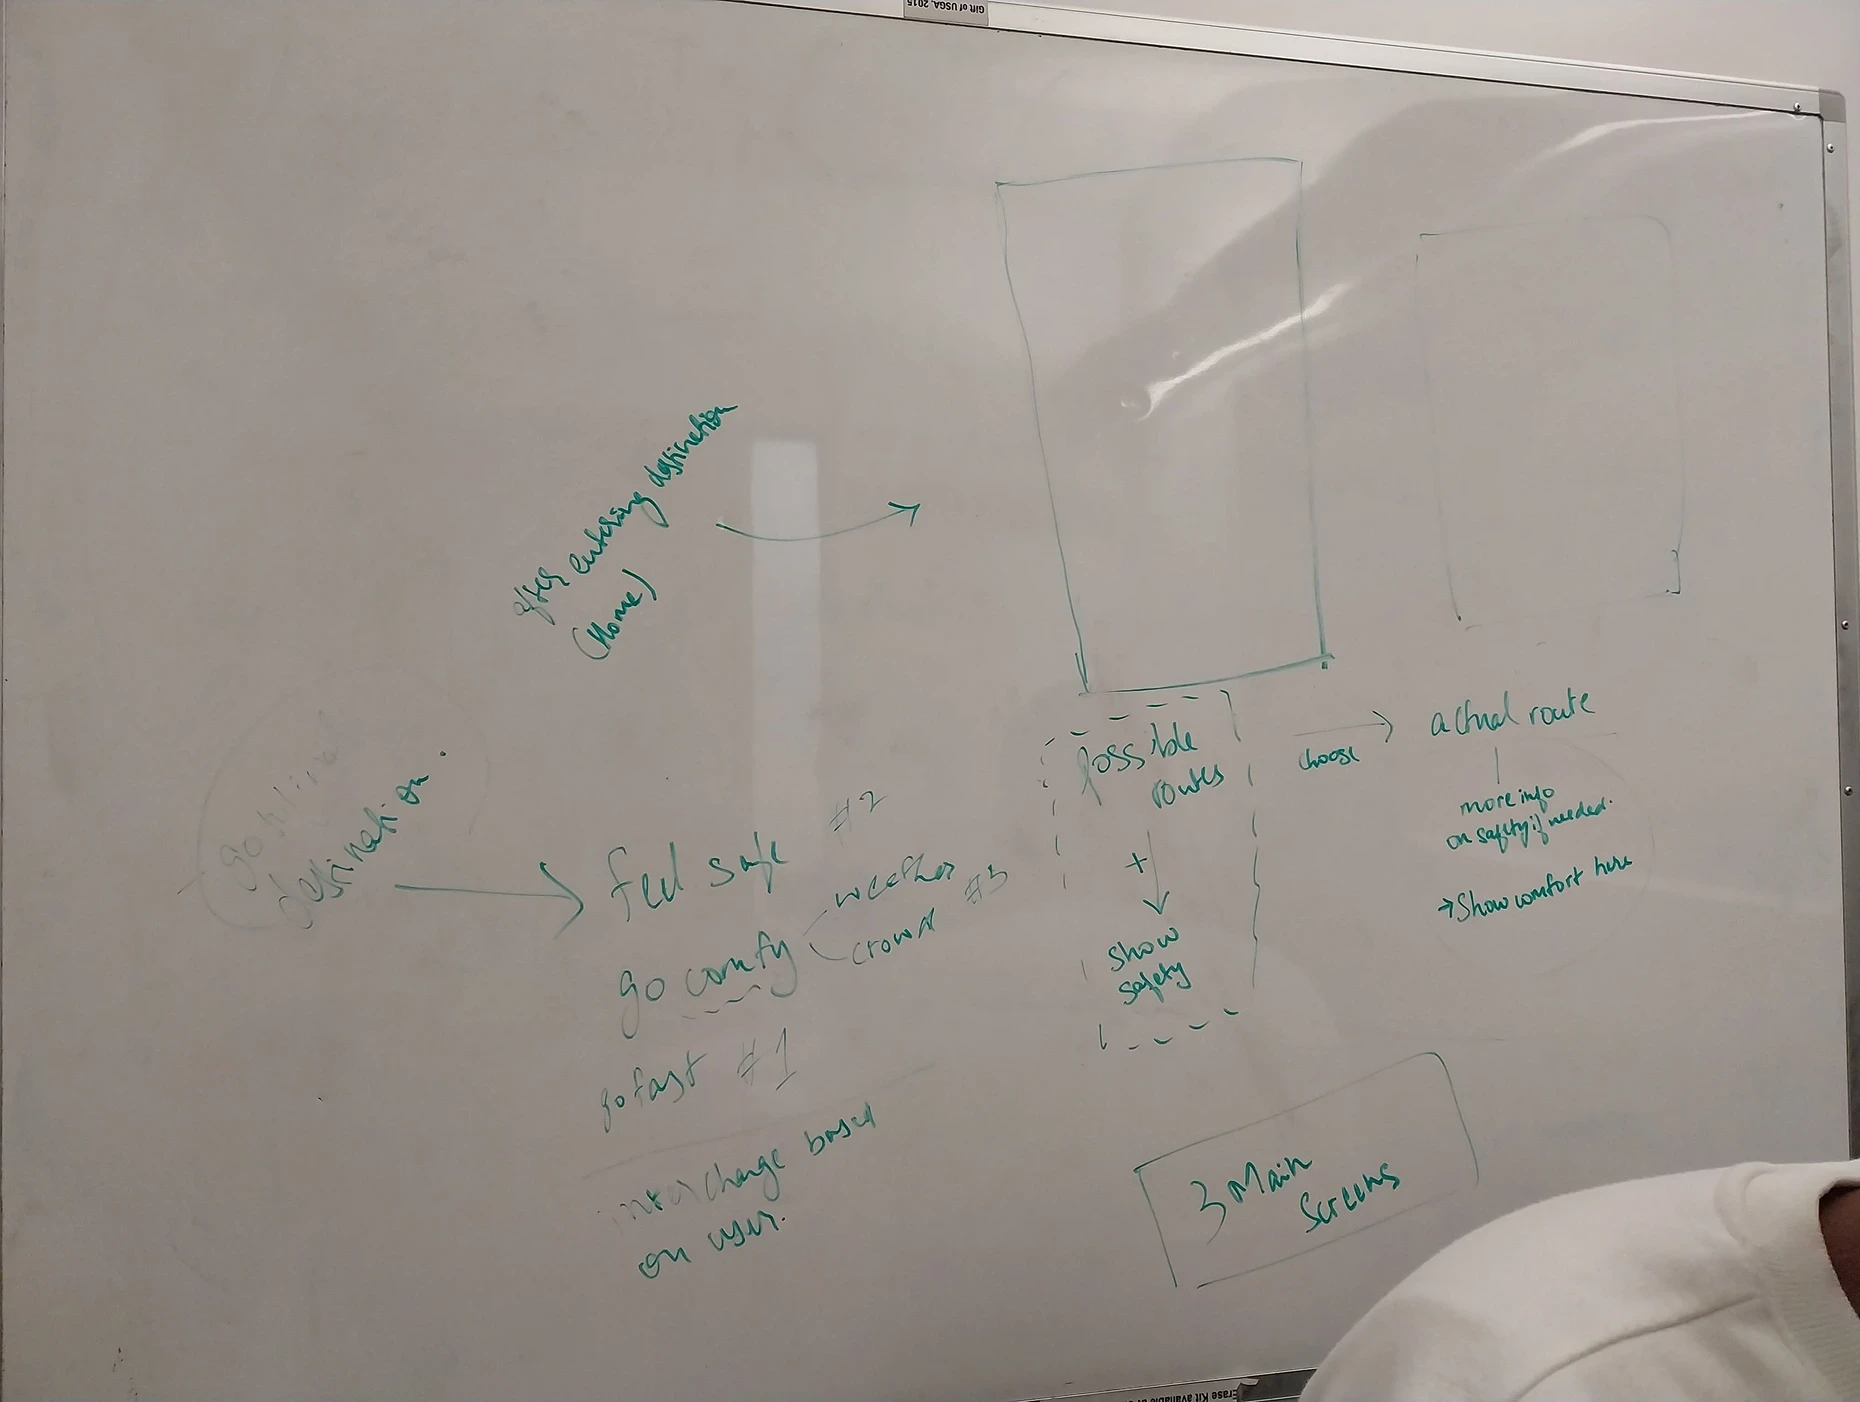
Sketching and brainstorming
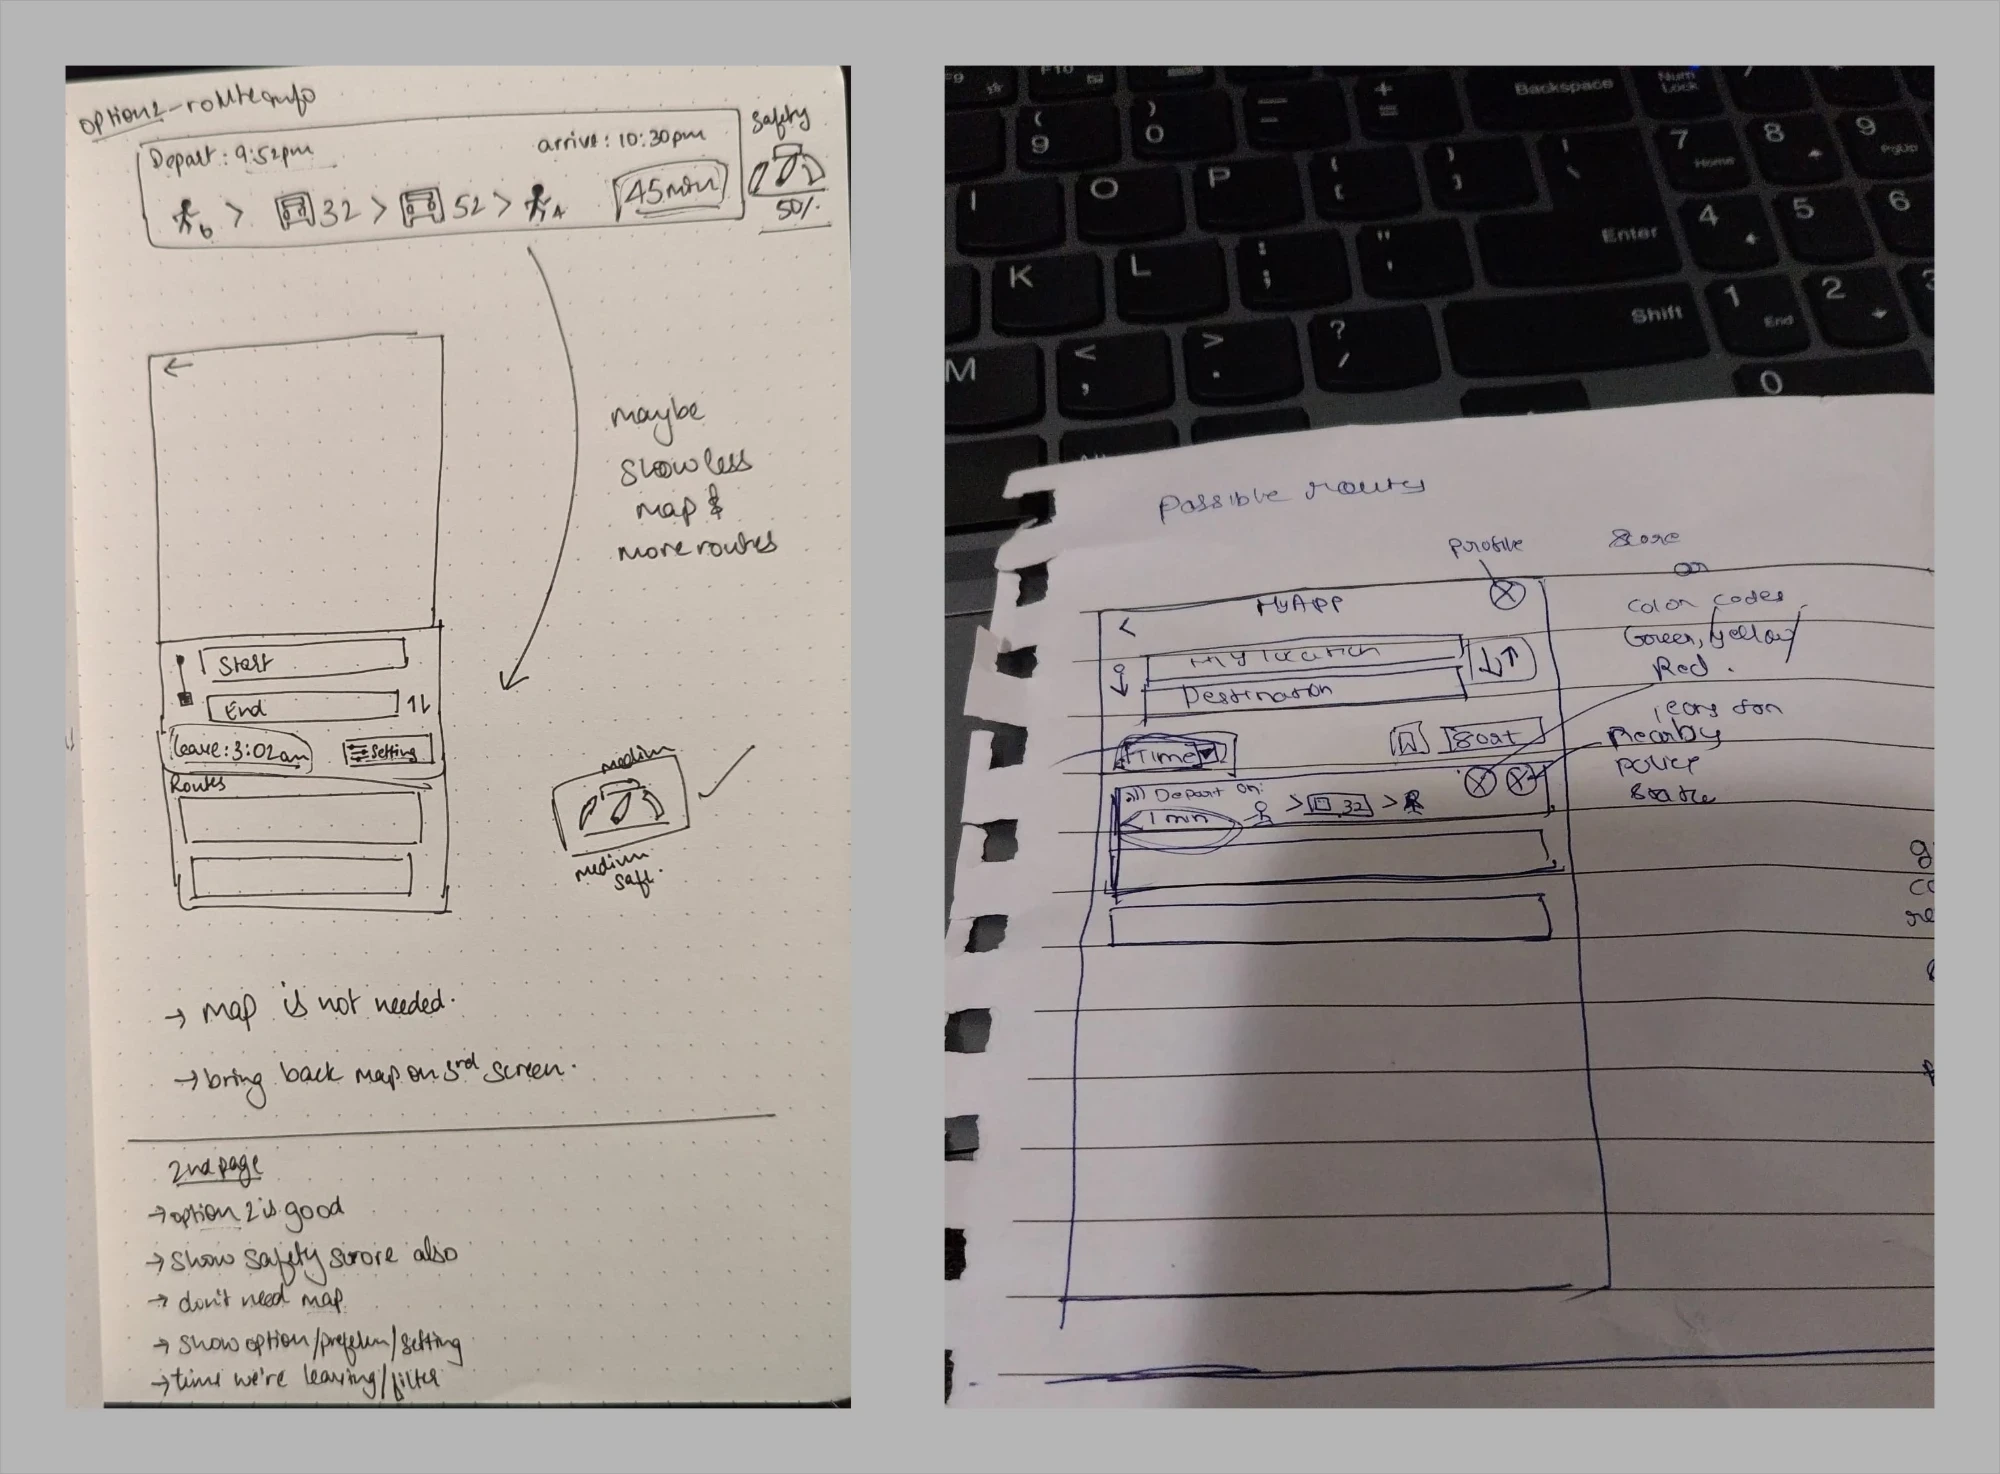
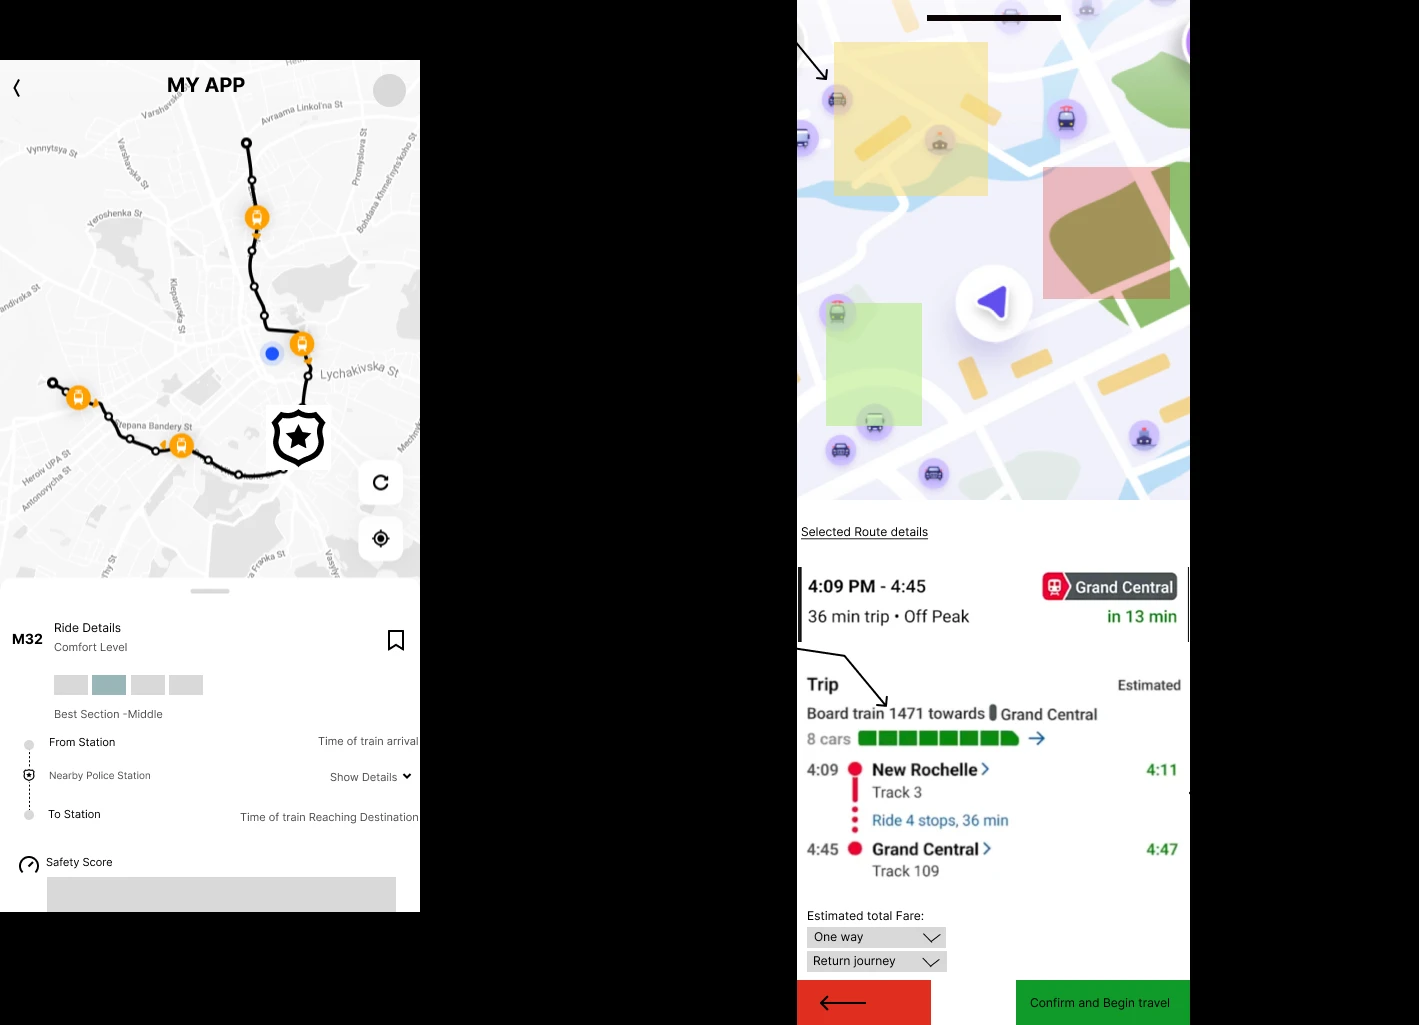
The conceptual model
Designing interactions around clarity, not complexity
Large, high-contrast icons, easily readable typography, and simple navigation keep the app approachable. Color-coded safety meters and crowd density visualizations give people quick, easy-to-understand information, and interactive heatmaps with route previews make the decision-making process faster.
Data sources feeding the app
- IoT sensors at stations: real-time crowd density data.
- Vehicle sensors: train and bus occupancy rates.
- User input: crowdsourced reports on safety and disruptions.
- Third-party APIs: traffic, weather, and real-time transit timetables combined for a full picture.
AI-driven features
- Crowd density classification: AI sorts locations into least, moderately, and most crowded using IoT sensor data.
- Dynamic route optimization: routes balance speed, comfort, and safety based on preferences, crowding, and traffic.
- Safety alerts: route-specific safety ratings from user reports, real-time updates, and historical data.
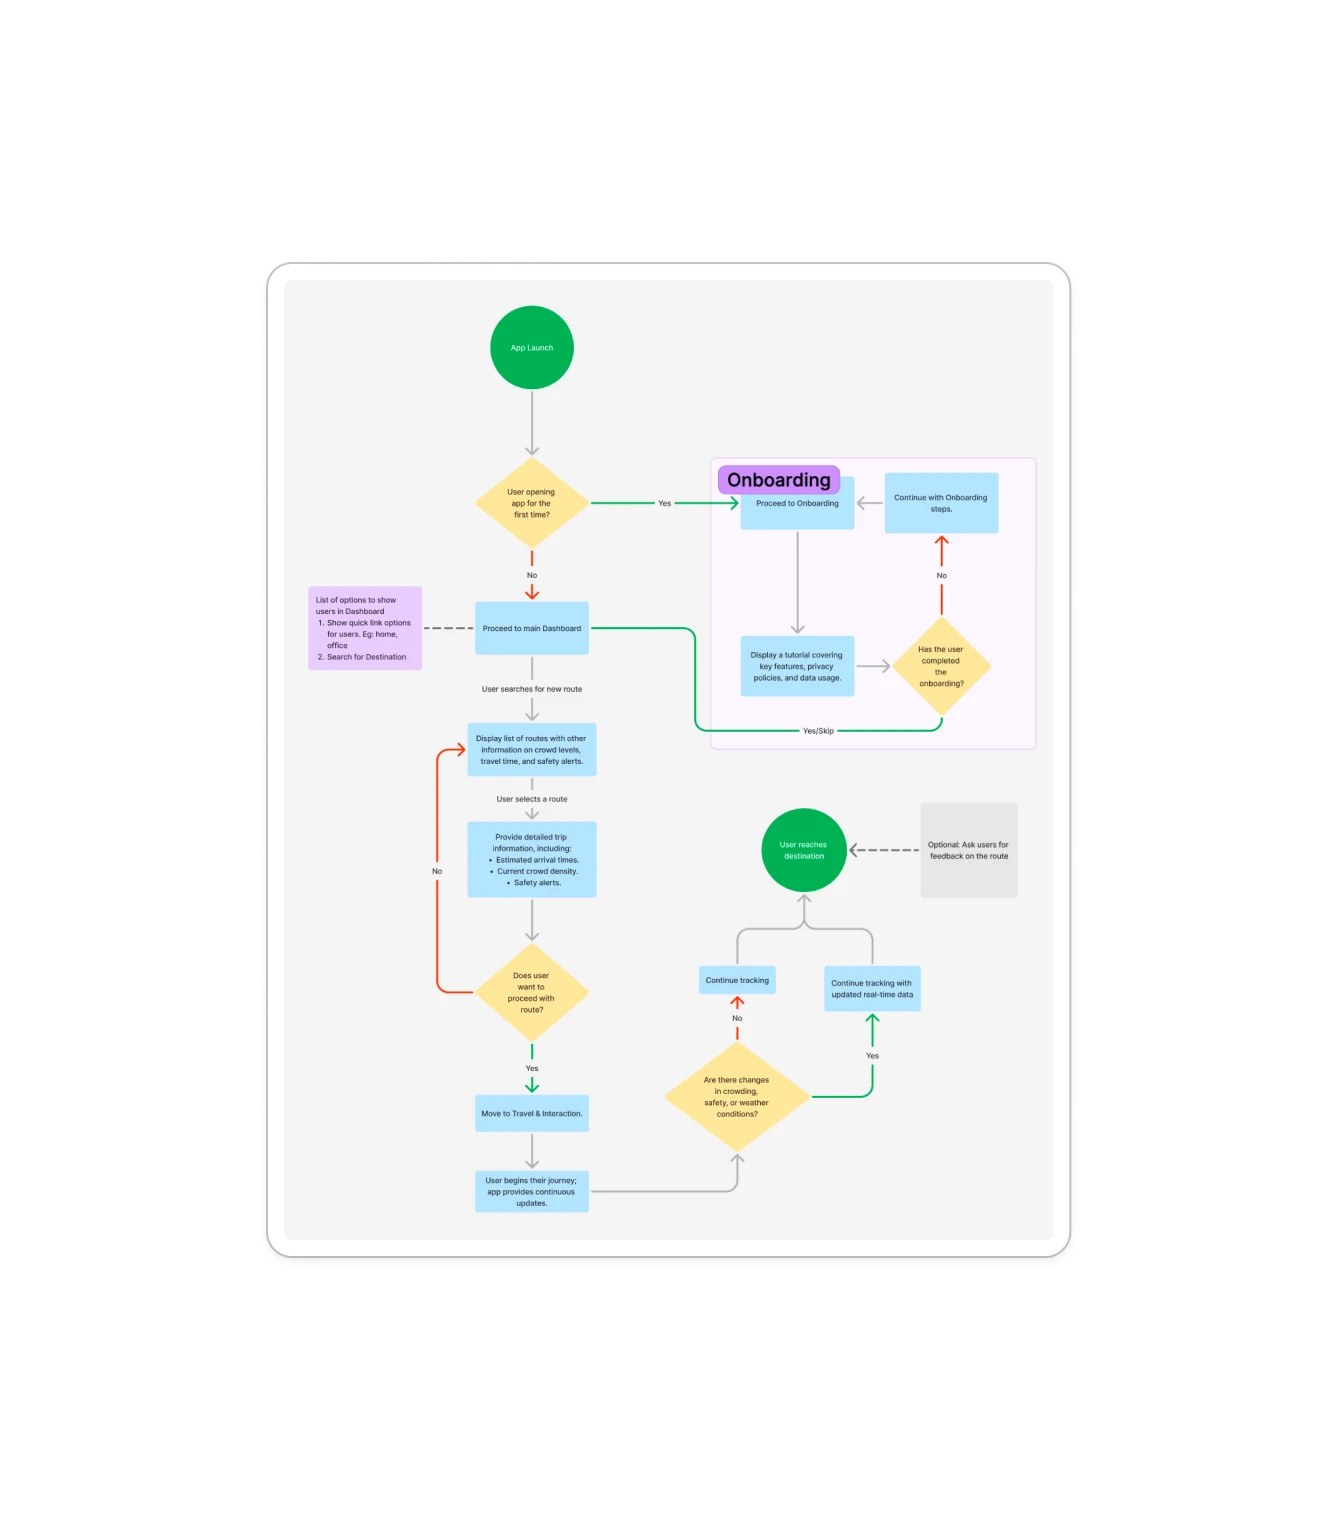
Concrete design
From flow to screens
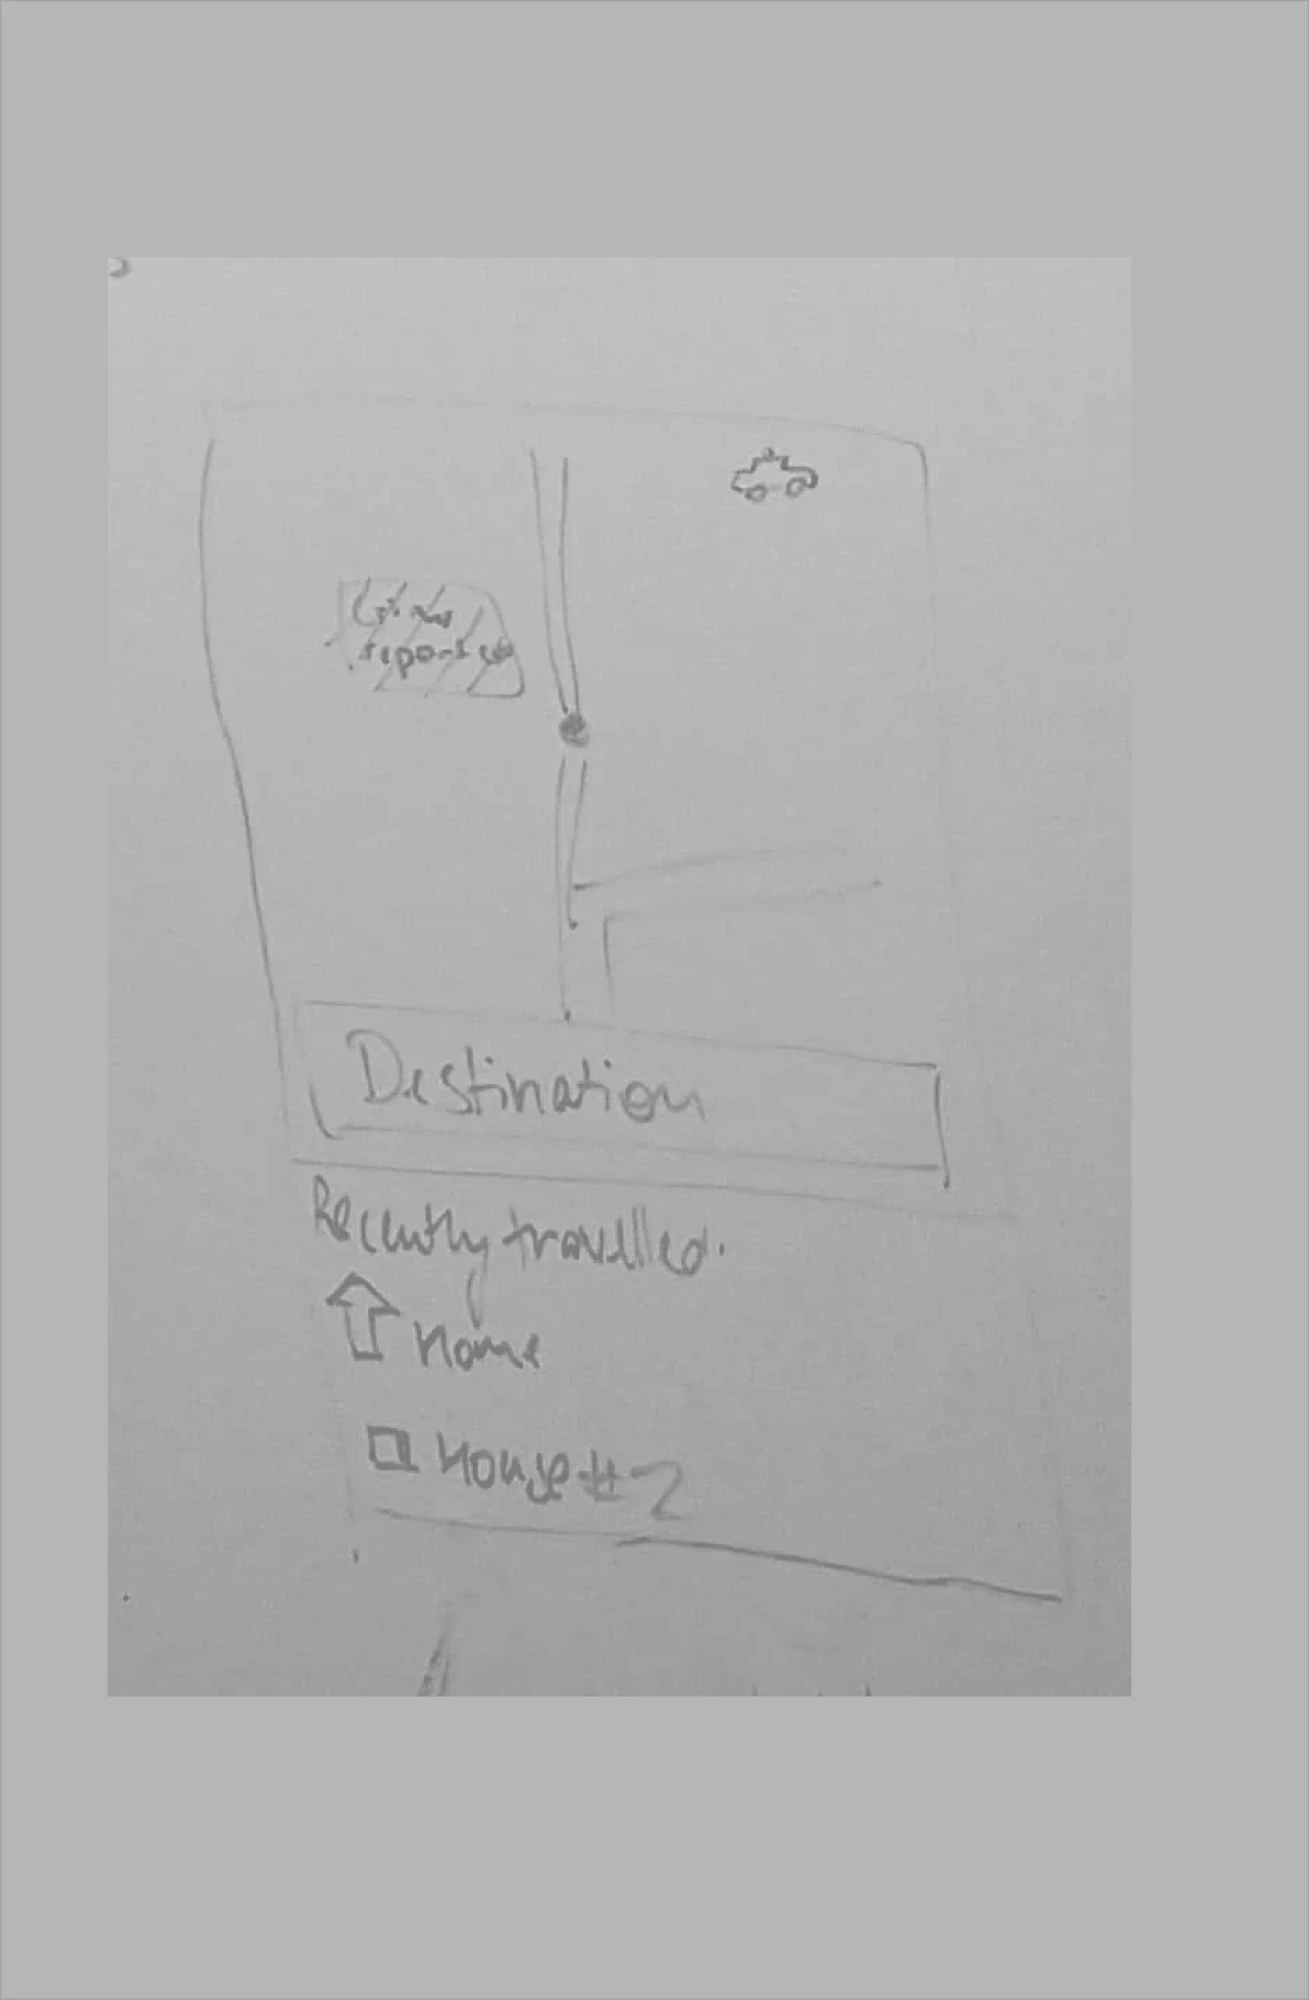
The Home Screen is TransitEase's main hub: a search box for destinations, an interactive map with current crowd density indicators and nearby stops, and quick access to saved routes and preferences.
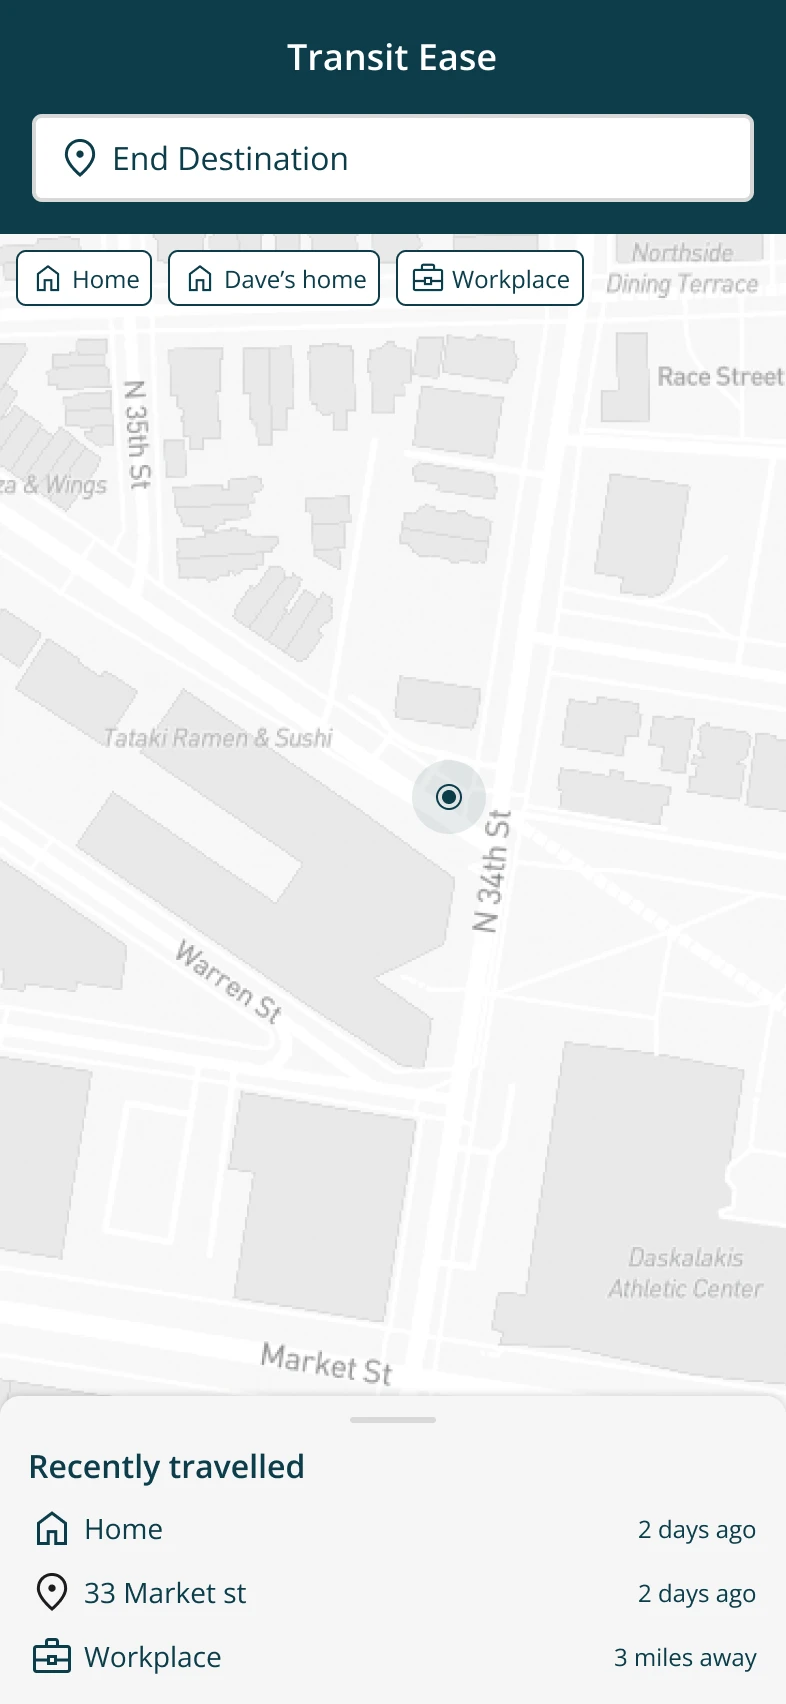
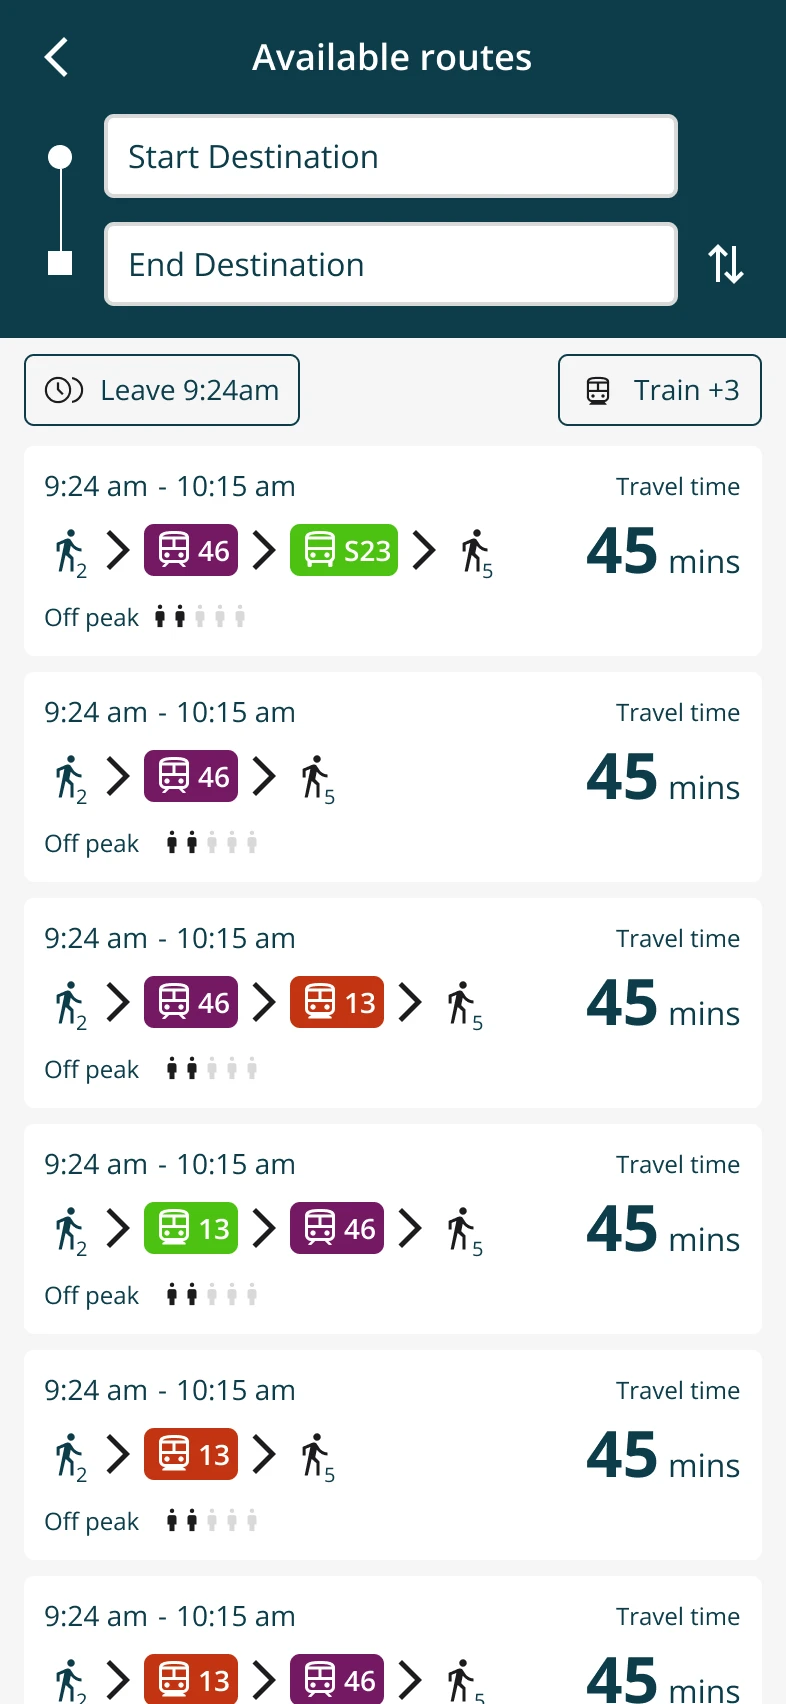
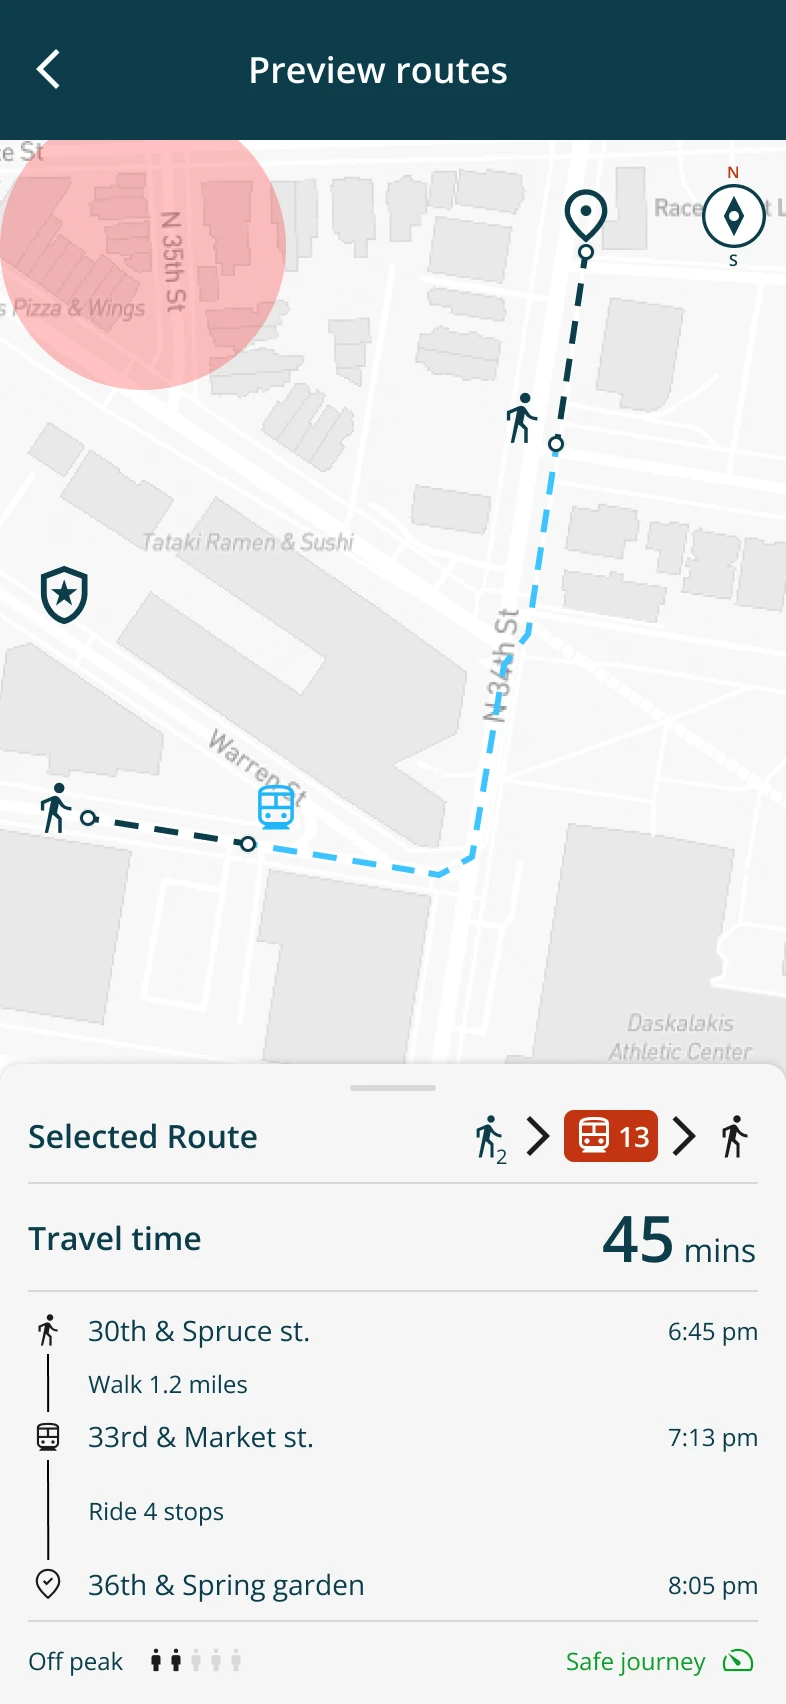
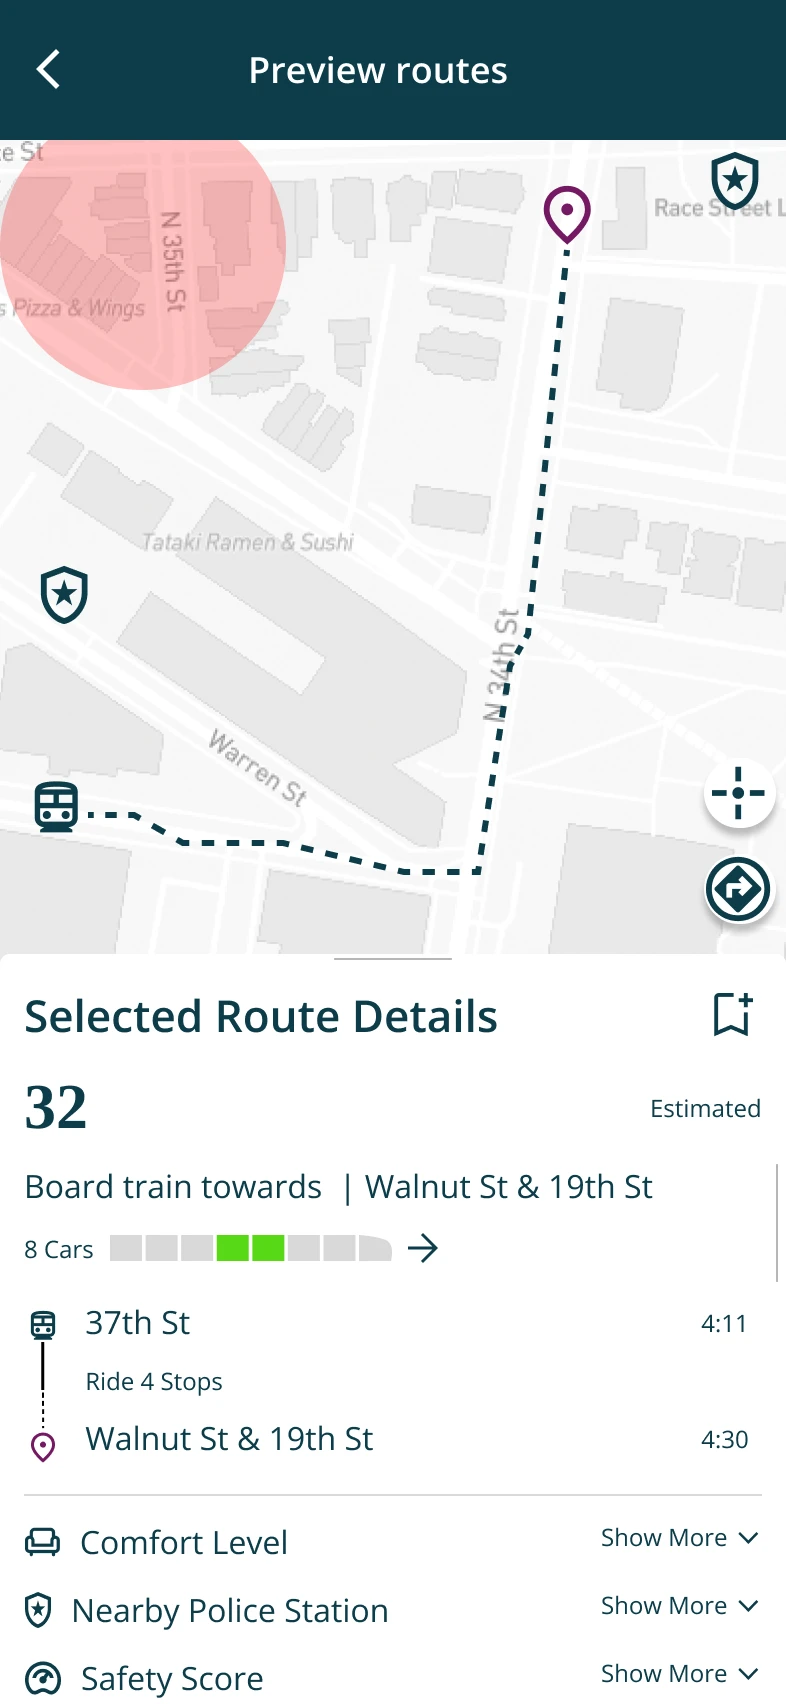
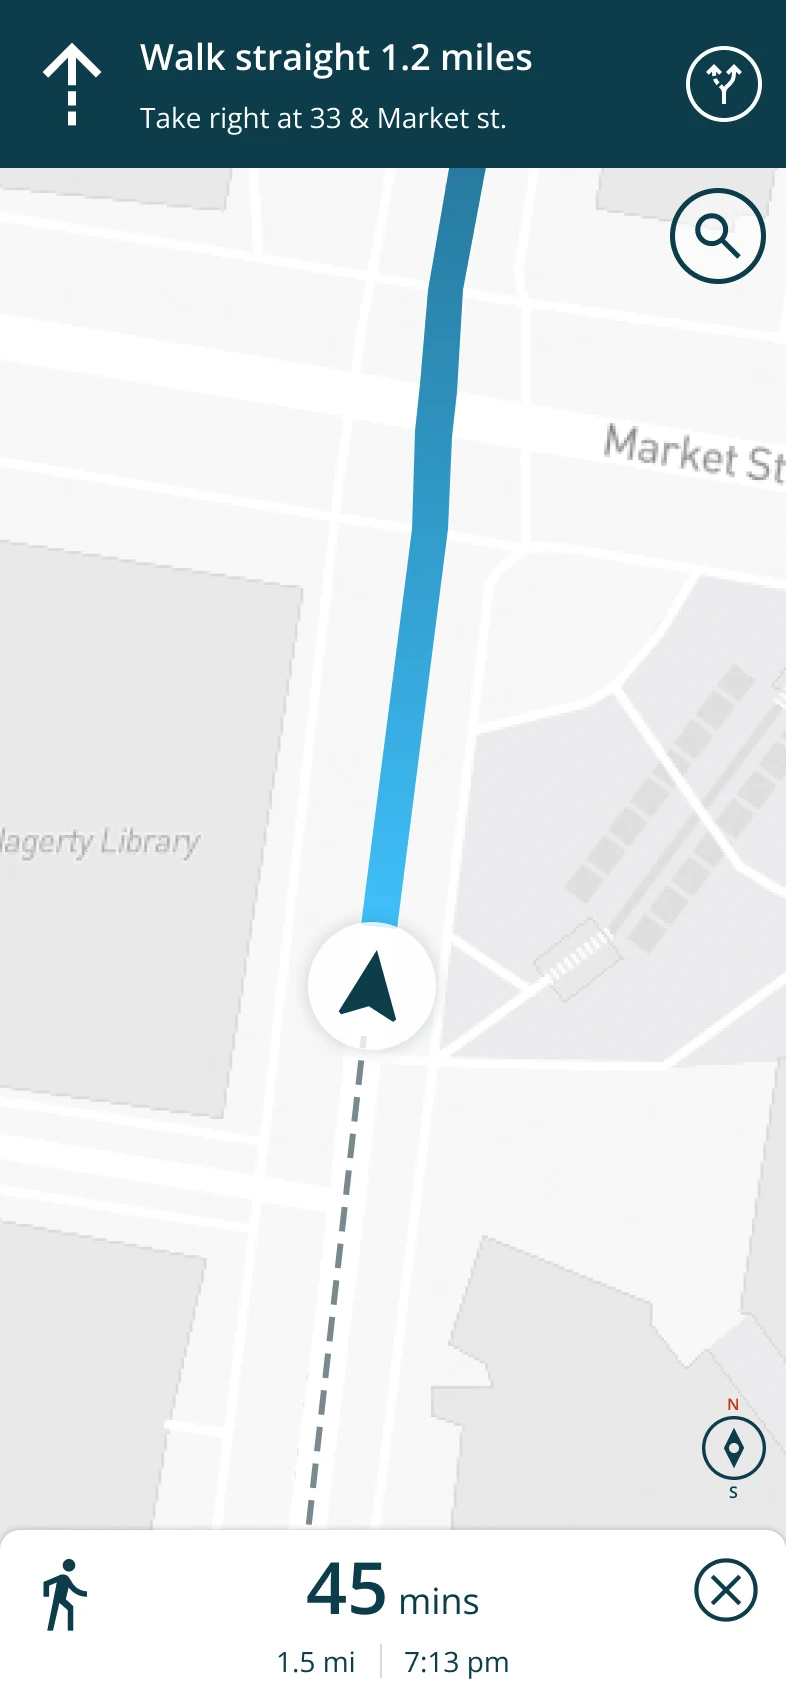
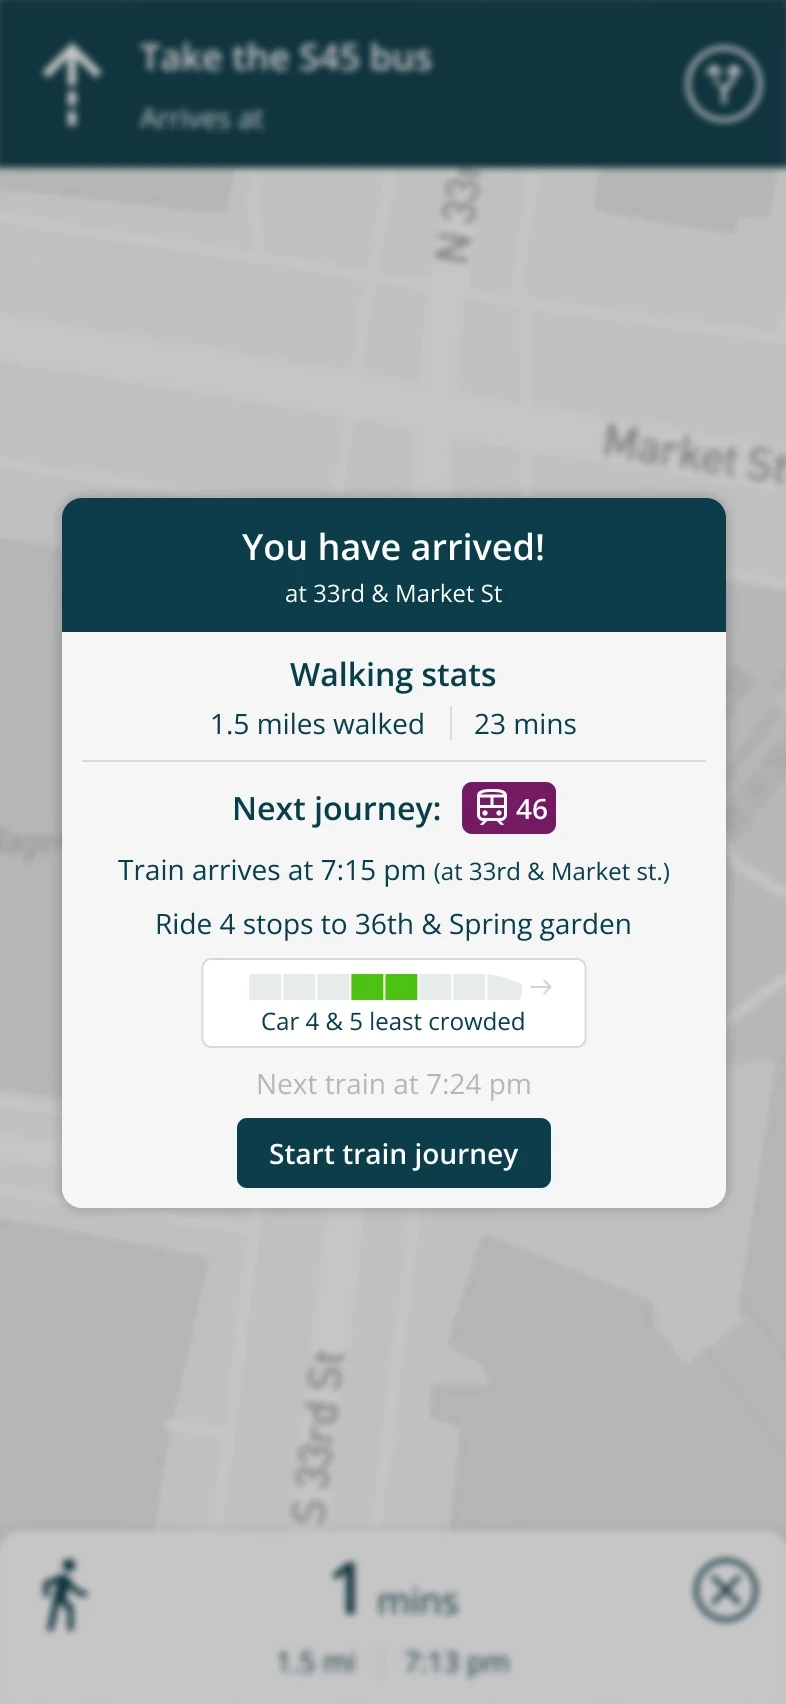
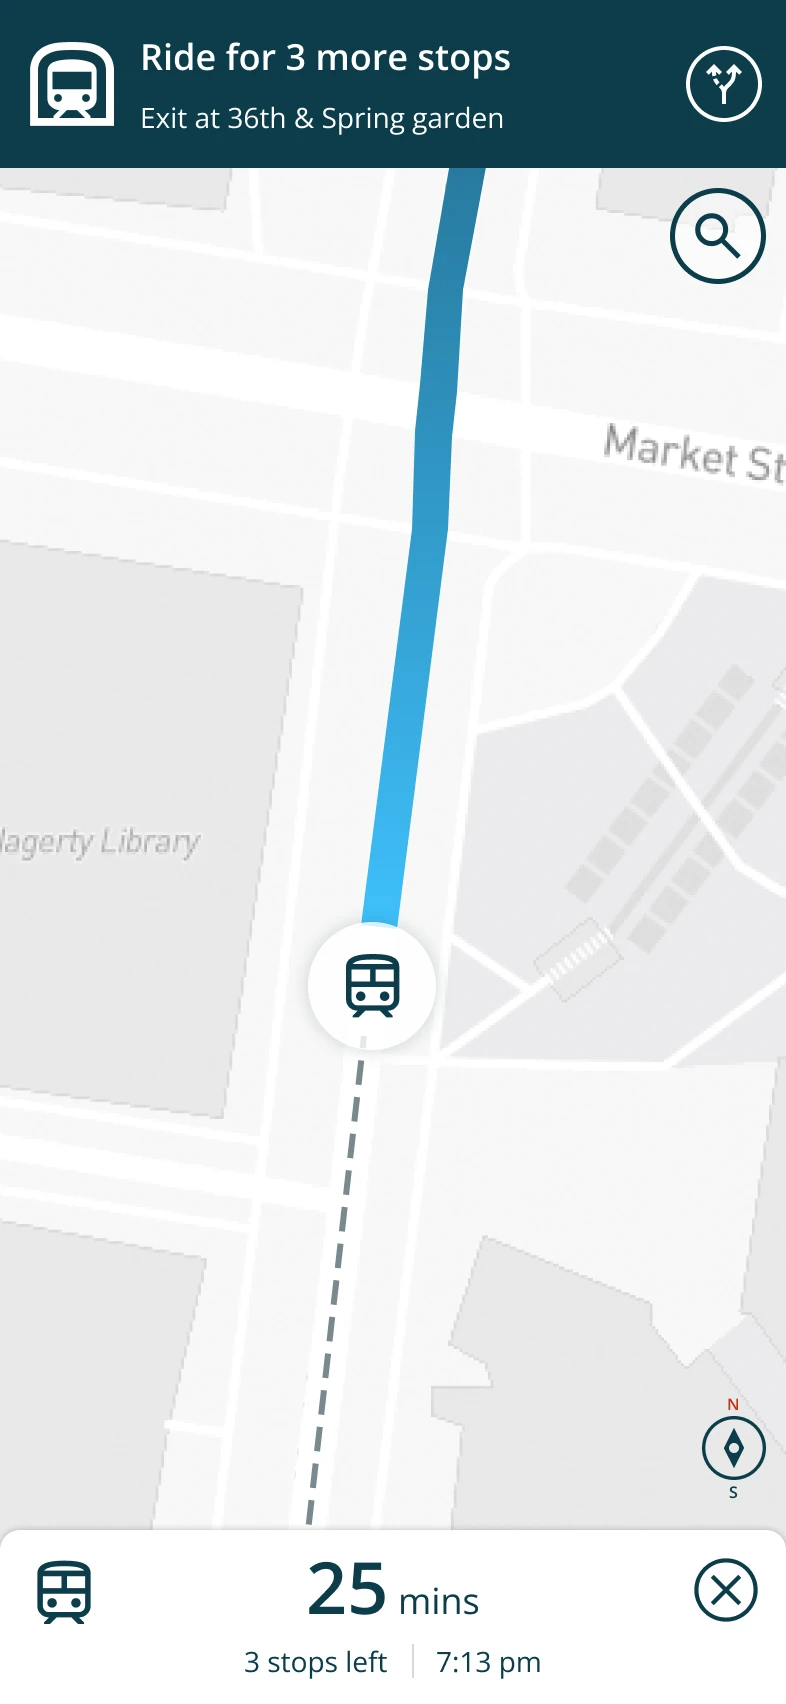
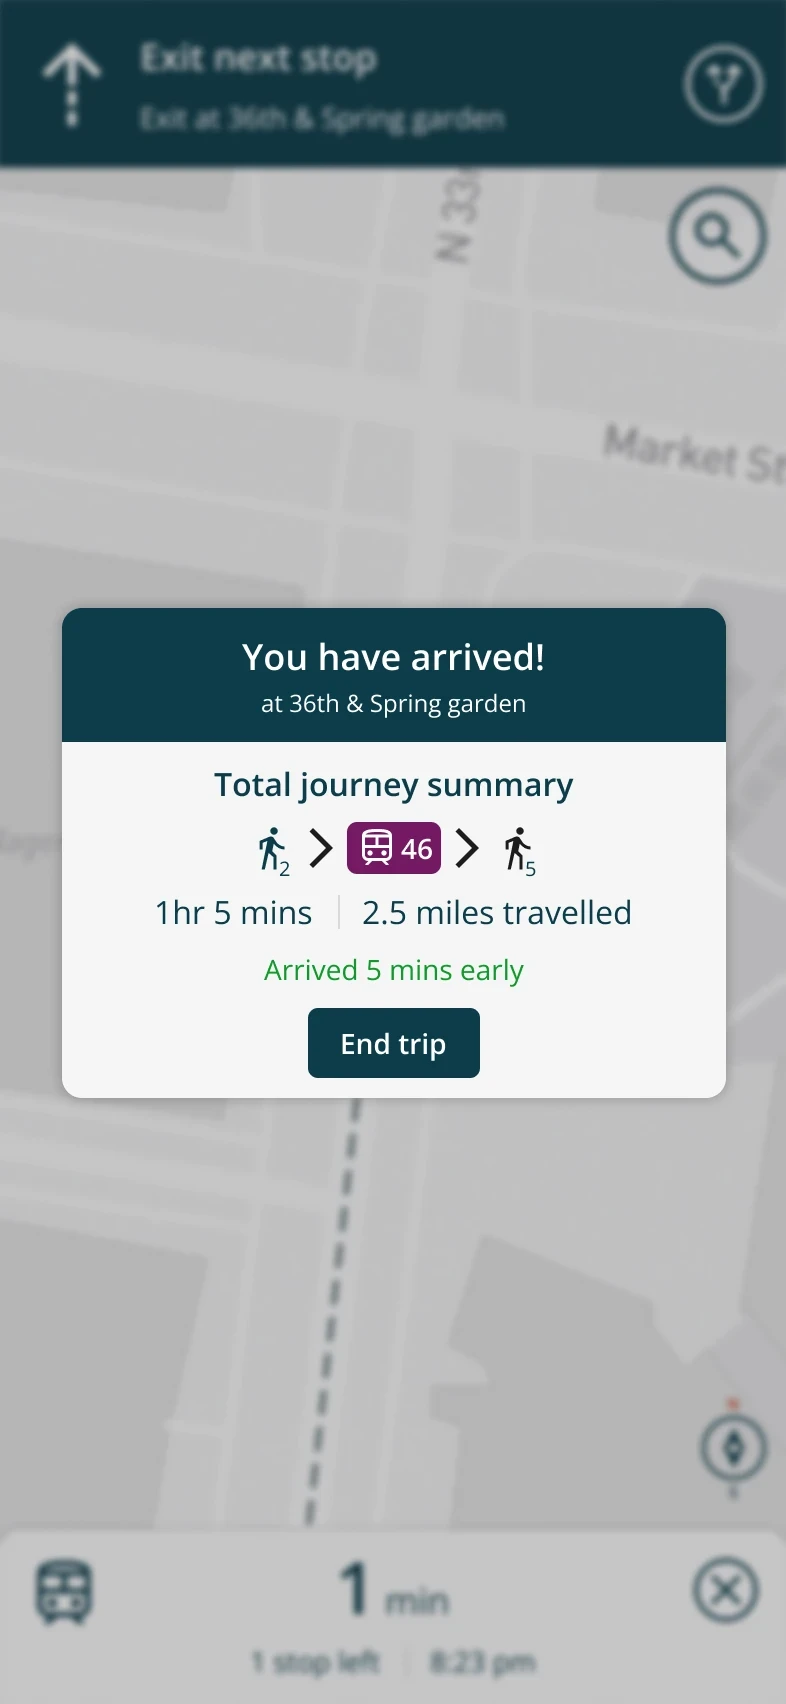
Route Selection ranks options by estimated travel time, crowd density, and a visual safety meter. Route Details breaks the chosen route down with turn-by-turn navigation, real-time safety and crowding updates, and key transit hubs highlighted on the map. The confirmation flow keeps people informed all the way to arrival, including which train car is least crowded.
Visual identity
Integrating AI
Detecting crowd density with Teachable Machine
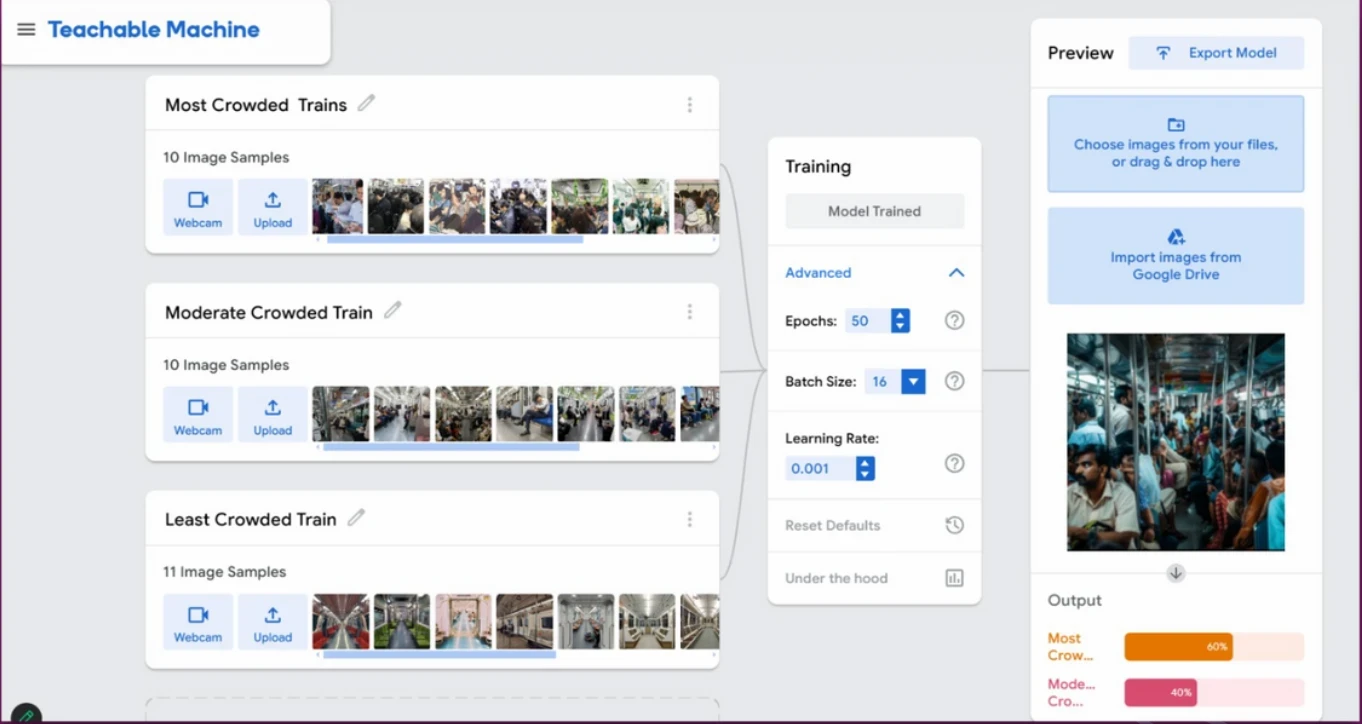
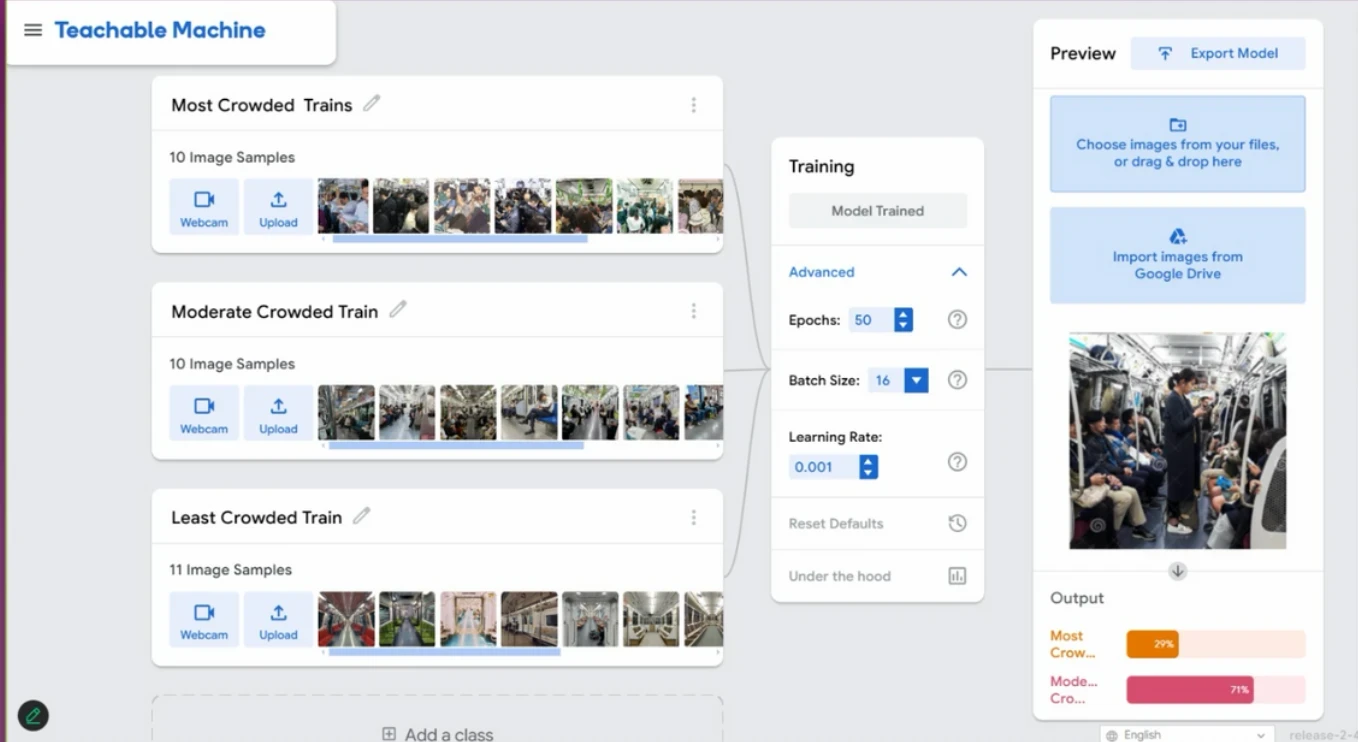
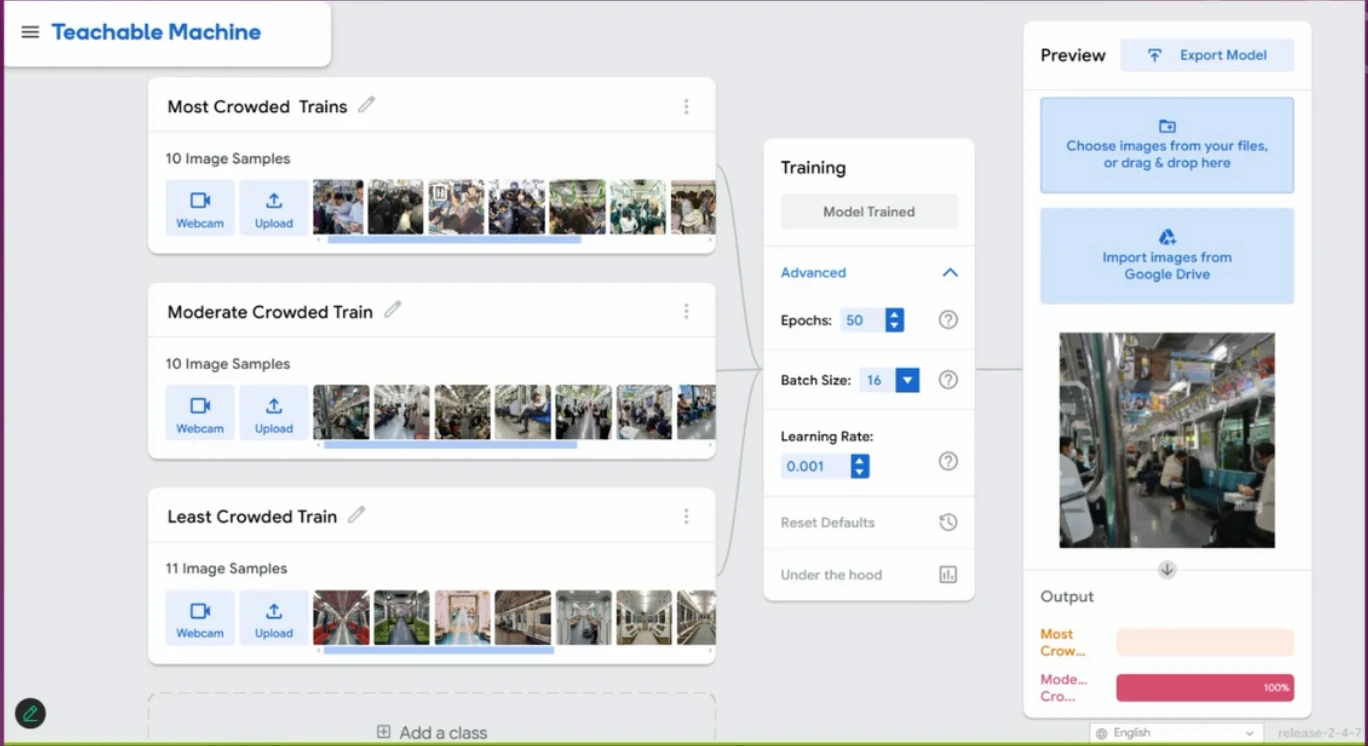
We used Google's Teachable Machine to train a model that classifies transit crowding into three levels, Most Crowded, Moderately Crowded, and Least Crowded, so people can choose which part of a train or station to head for based on their comfort level. We trained it on a set of sample photos in each category, then tested it against further images to check its accuracy and practicality. Connected to real-time video feeds or other crowd-monitoring sources, the same model could feed live crowd density data straight into the app.
Ethical considerations
- Privacy and data gathering: real-time location and crowd data raises privacy concerns. We'd anonymize data, use secure storage, and give users control over data-sharing.
- Algorithmic fairness & bias: underrepresented stations or communities in the data could skew predictions unfairly. Human-reported conditions alongside sensor data, plus routine audits, help guard against that.
- Responsibility & transparency: if a recommendation leads to discomfort or a missed connection, trust depends on being clear about how and why the app suggested it.
- Inclusion & accessibility: people with disabilities or mobility needs require specific accommodations, from language preferences to mobility aids, ideally shaped by ongoing consultation with disability advocacy groups.
What I learned
Reflected- Understanding transit challenges more deeply through research and prototyping, rather than assuming we already knew the pain points.
- Working through the real difficulty of integrating multiple data sources cleanly into one UI/UX, not just designing screens in isolation.
- Picking up real insight into commuter behavior and what actually helps optimize a transit experience, versus what just looks good on a screen.
- Run usability testing with a wide range of commuter profiles, senior users, parents, and people with disabilities, measuring task completion time, error rates, and satisfaction.
- Carry out a heuristic evaluation against Nielsen's principles, covering system status visibility and error prevention/recovery.
- Add an in-app feedback loop so commuters can rate their experience and report problems directly.
- Extend features: voice interfaces for hands-free navigation, gamification for eco-friendly routes, and wearable integration.
- Build predictive analytics for delay forecasting and dynamic crowd density forecasting, and grow the training dataset across more transit environments and demographics.